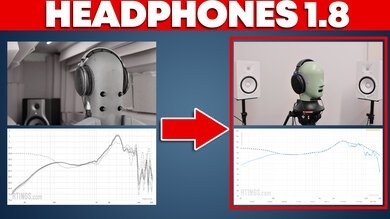
Headphone enthusiasts often debate the ideal frequency response, while researchers generally favor a preference-based approach to defining it. Extensive work by Harman and others has established useful targets, but those curves cannot simply be transferred to every measurement system. New equipment and standards require fresh evaluation.
To explore what a target should represent on its new test fixture, RTINGS.com returned to double-blind listening tests. Thirty-five participants rated five curves using two music clips, producing 350 ratings—and no single clear favorite.
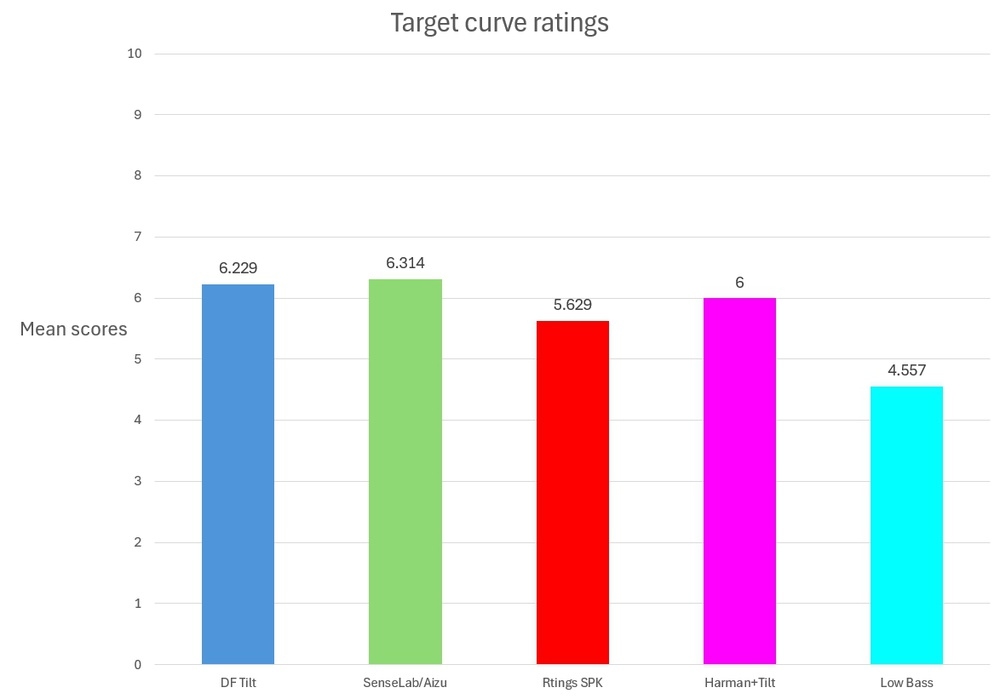
The results support taking personal taste seriously. Frequency response remains the most important parameter for perceived sound quality, and its measurement provides valuable buying guidance. The challenge is to assess objective performance accurately without overlooking differences in preference.
Why the B&K Type 5128-B Requires a New Target
A Broader Measurement Standard
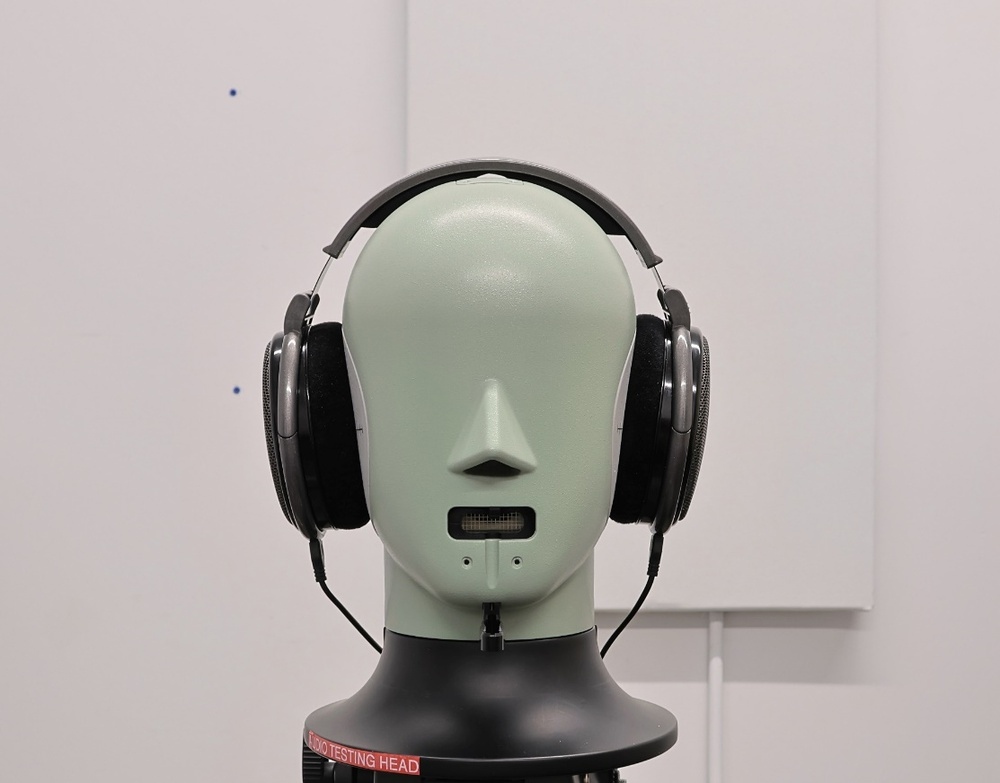
RTINGS.com adopted the Brüel & Kjær (B&K) Type 5128-B Head and Torso Simulator, called the 5128 here, to improve objective measurements and broaden its evaluations. The platform updates an approach to headphone measurement that has been in use for more than 40 years.
The ear couplers on the previous HMS II.3 fixture follow the older, still widely accepted IEC 60318-4 standard. That standard specifies performance from 100Hz to 10kHz, rather than across the full audible range of 20Hz to 20kHz. Such couplers can measure outside their specified range, but without defined tolerances, matching results between units under identical conditions cannot be guaranteed.
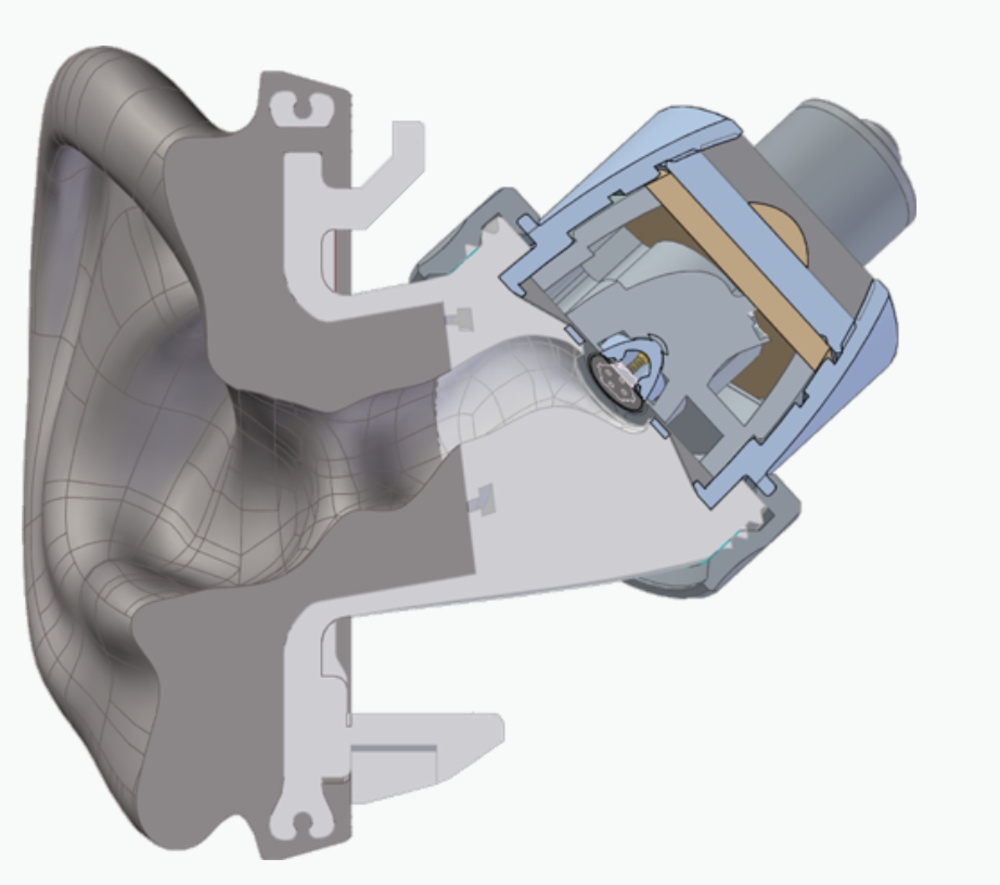
The B&K Type 4620 ear simulator was developed to address these limitations. It is designed to:
- Measure across the full audible frequency range.
- Represent the geometry of an average human ear canal.
- Present the acoustic impedance of an average human ear.
This does not invalidate earlier measurements from RTINGS.com or other organizations. Headphone testing has always involved uncertainty, both because human anatomy varies and because the measurement process itself introduces unavoidable variation. Better equipment can reduce these limitations, not eliminate them.
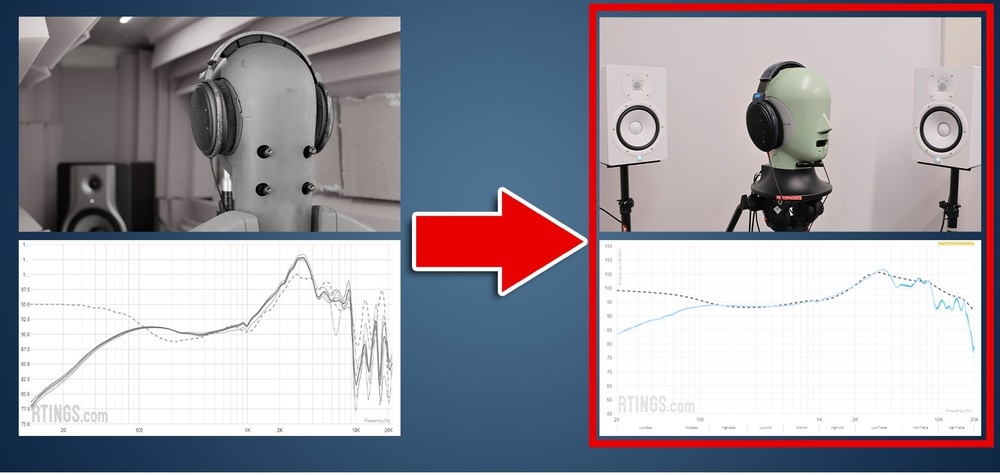
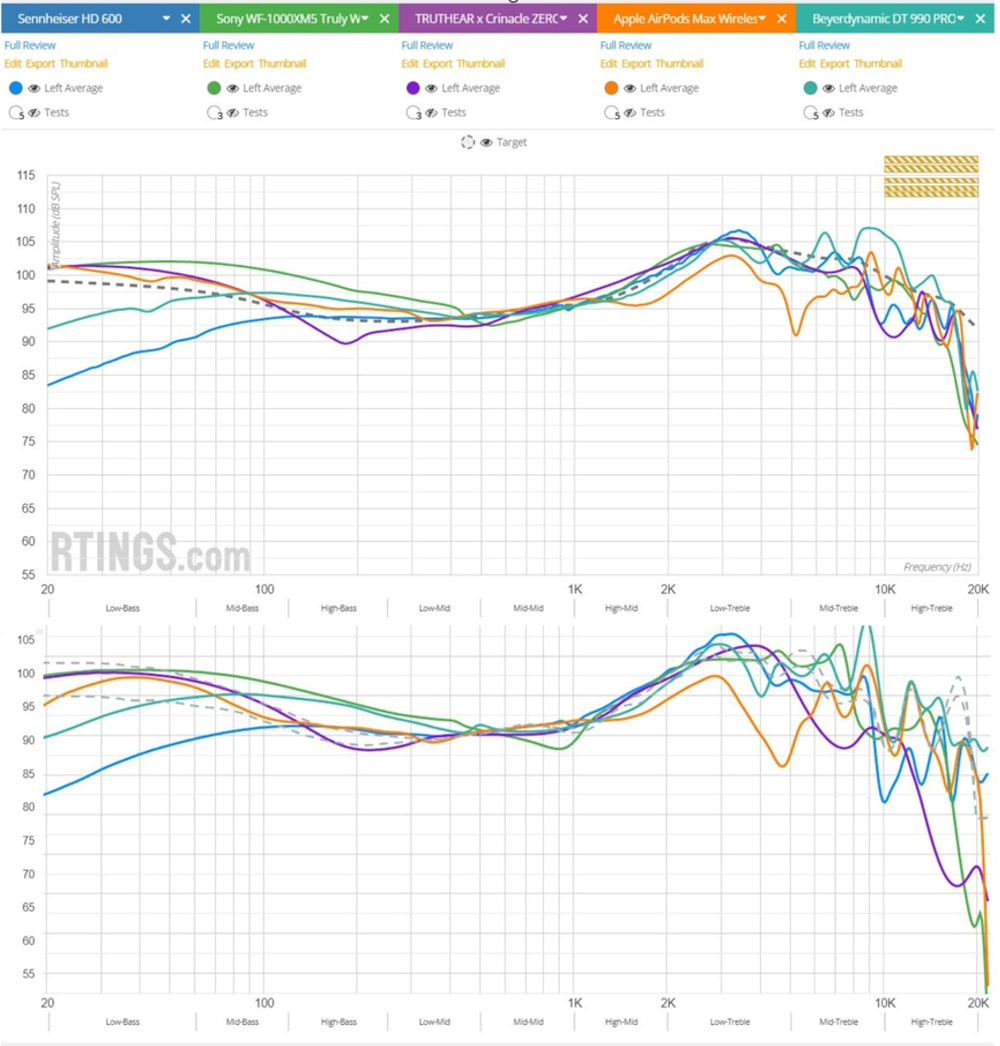
Results from the new fixture remain familiar to interpret, although their appearance changes somewhat. The largest differences occur at high frequencies, where the HMS II.3 has a notably uneven response. RTINGS.com also observed bass changes, but these were not consistent or repeatable across headphones.
The comparison below places 5128-B measurements above HMS II.3 measurements for several headphones. The differences are not dramatic, but the graphs are not interchangeable.
A Different Fixture Needs Its Own Reference
Frequency response measurements need a target for comparison. Because the HMS II.3 and 5128 produce different results, they also need different targets—and there is no direct conversion between them.
Most earlier headphone frequency response research, led largely by Harman, used IEC-60138-4 compliant couplers, often called 711 couplers. Consequently, relatively little preference data was available for the 5128 when RTINGS.com adopted it.
The Listening Study
Participants, Curves, and Procedure
RTINGS.com conducted a double-blind listening test with 35 employees to investigate which responses they preferred. Participants rated five sound profiles from 1 to 10 while listening to two 25-second excerpts: Daft Punk's Get Lucky and Steely Dan's Cousin Dupree.
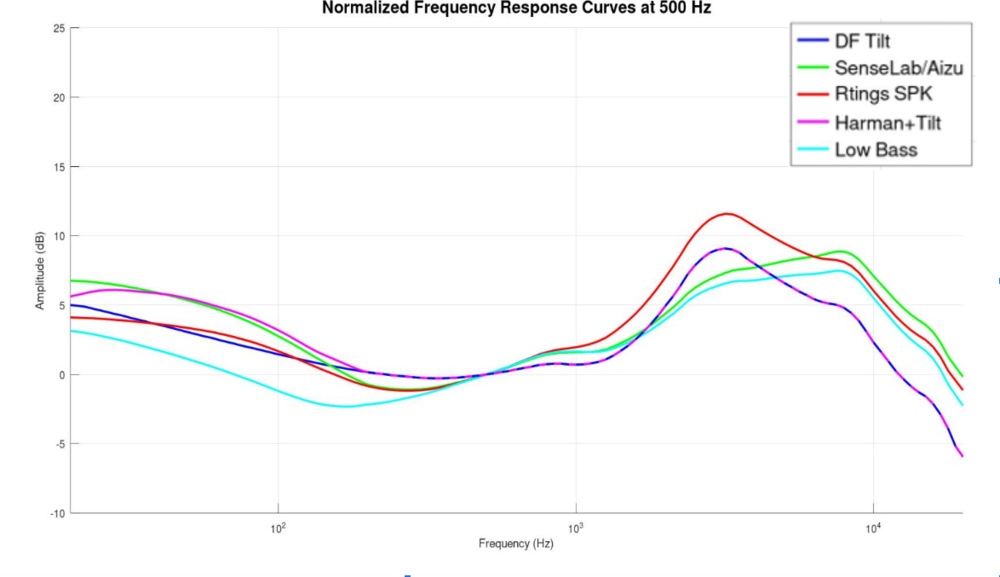
Four profiles had a basis for potentially representing a balanced sound. The fifth served as an anchor:
- Blue (DF Tilt): The 5128's known neutral diffuse field response with a -1 dB per Octave tilt.
- Green (SenseLab/Aizu): A visual approximation of the average preferred 5128 curve presented by Ravizza et al. in an Audio Engineering Society publication1.
- Red (RTINGS.com SPK): RTINGS.com's speaker target, itself based on Harman research, with the 5128's diffuse field response applied.
- Magenta (Harman+Tilt): The known bass behavior of the Harman Over-Ear 2018 target combined with a -1 dB per octave tilt from 200Hz upward.
- Cyan (Low Bass): The magenta curve modified with a -4 dB shelving filter below 300Hz and a -5 dB bell filter centered at 3000Hz. This substantially reduced-bass anchor had no research or established principle suggesting it would be preferred.
Before scoring began, each volunteer heard a two-minute excerpt of Dire Straits' Sultans of Swing, with randomly switched EQ curves. No ratings were requested during this familiarization period.
The curve order was randomized for the first scored excerpt and randomized again for the second. Levels were calibrated to 85 dB SPL A Weighted, with compensation for small level differences caused by the responses. Sennheiser HD 650 headphones were equalized to match each evaluated curve. AutoEQ generated the profiles, Equalizer APO applied them, and EACS (Equalizer APO Config Switcher) enabled live switching. After the first complete sequence, listeners could revisit any curve as often as they wished and in any order.
Different Preferences, Confident Ratings
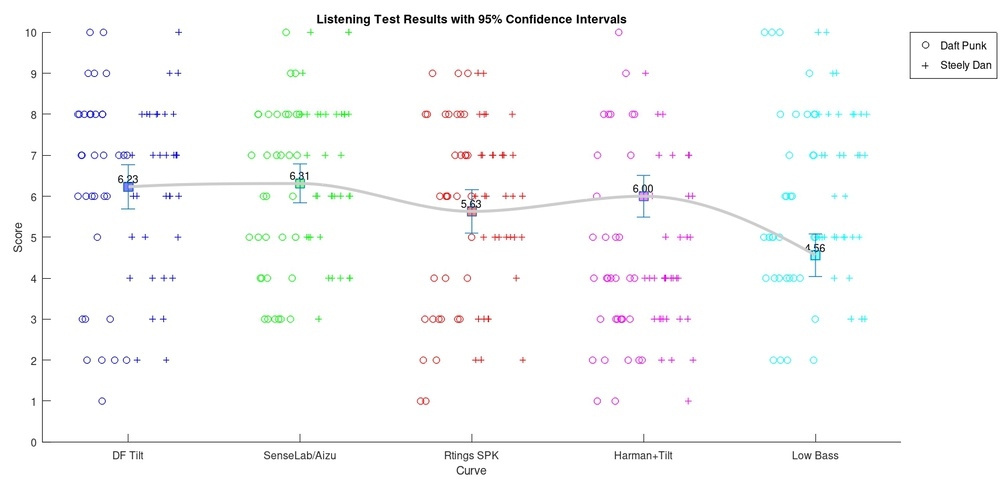

Four of the five curves were statistically tied. The table below gives the pairwise p-values; in the study's presentation, P>0.05 indicates statistically equal results.
| Curve | VS Curve | p-Value |
|---|---|---|
| DF Tilt | SenseLab/Aizu | 0.82394 |
| DF Tilt | RTINGS.com SPK | 0.08538 |
| DF Tilt | Harman+Tilt | 0.55422 |
| DF Tilt | Low Bass | 0.00001 |
| SenseLab/Aizu | RTINGS.com SPK | 0.05283 |
| SenseLab/Aizu | Harman+Tilt | 0.37290 |
| SenseLab/Aizu | Low Bass | 0.00002 |
| RTINGS.com SPK | Harman+Tilt | 0.27414 |
| RTINGS.com SPK | Low Bass | 0.00266 |
| Harman+Tilt | Low Bass | 0.00056 |
The Low Bass anchor was the least preferred profile with high confidence.
This small experiment does not definitively characterize listener preferences, nor does it overturn the larger studies conducted by Harman and others. RTINGS.com describes it as a meticulously conducted, valid double-blind test, while acknowledging its limited scale.
Individual choices were often consistent: 63% of participants selected the same favorite curve for both excerpts. No participant said the curves all sounded alike. Listeners heard differences and appeared engaged and confident in their ratings.
A short survey recorded the following participant characteristics:
- 6 women and 29 men.
- 12 participants aged between 20 and 30, and 23 older than 30.
- 14 audio professionals.
- 15 people who reported playing a musical instrument.
- 12 self-identified audiophiles.
The last three categories overlapped, with 25 participants belonging to at least one. The sample was too small for firm conclusions about demographic or experience-related differences, including the kinds of trained/untrained, geographic, gender, and age distinctions explored in earlier research.
No significant preference differences emerged from these characteristics except that women appeared to favor the Low Bass curve more than men. That observation agrees with some earlier research2, but only six women participated, so it warrants caution.
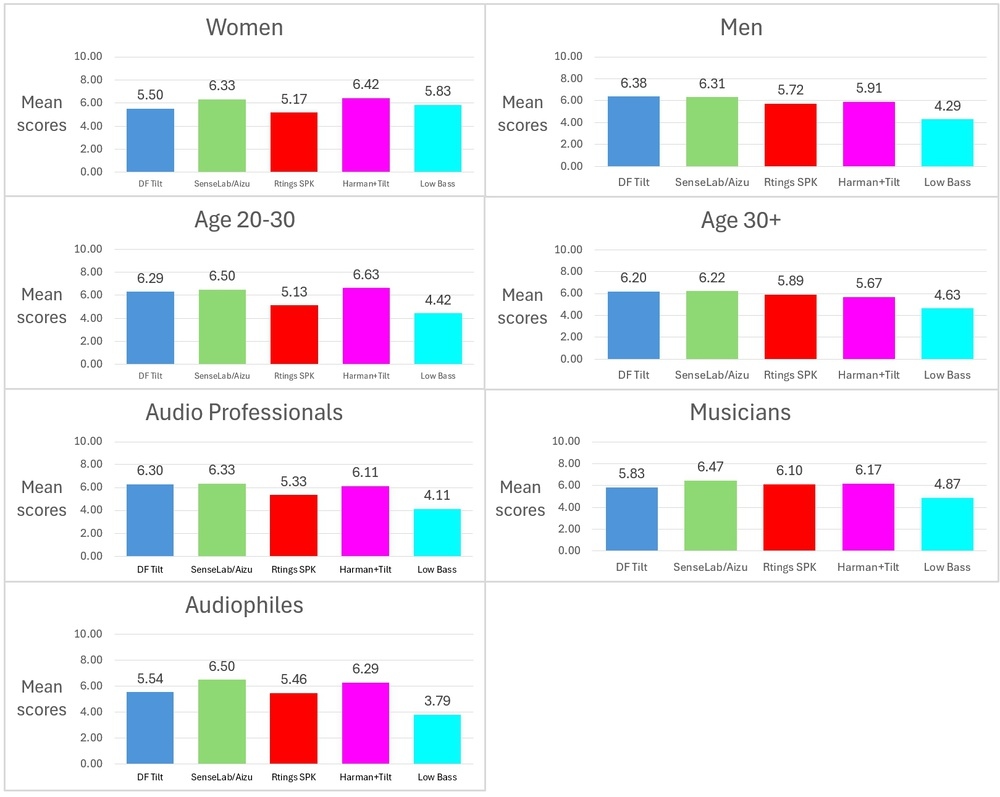
The study did not identify one ideal target. It showed that listeners can hear relatively small differences without agreeing on one universally correct response. Equally, the poor reception of the Low Bass anchor indicates that not every response is equally acceptable.
A Simple Reference Target
RTINGS.com's response was to follow the principle associated with the late engineer Kelly Johnson: “Keep it simple, stupid.” Its new target uses a small set of adjustments to a known reference.
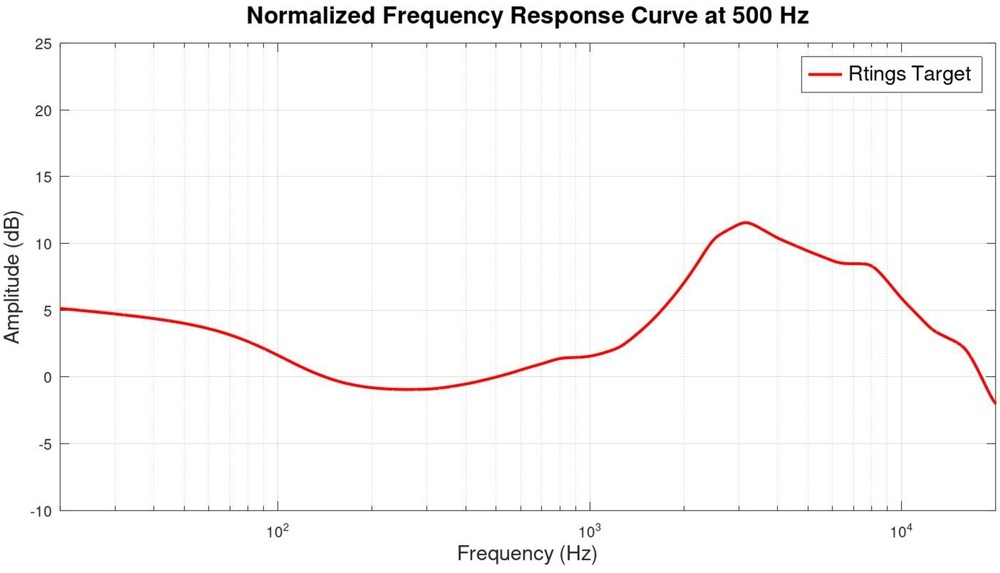
Starting with the 5128 HATS response in a flat diffuse field, RTINGS.com:
- Applied a -6 dB tilt across the audio band (0.6 dB/octave).
- Added a 4.3 dB bass shelf (@105Hz, Q .707).
- Smoothed the result to 1/6th octave.
The Diffuse Field Starting Point
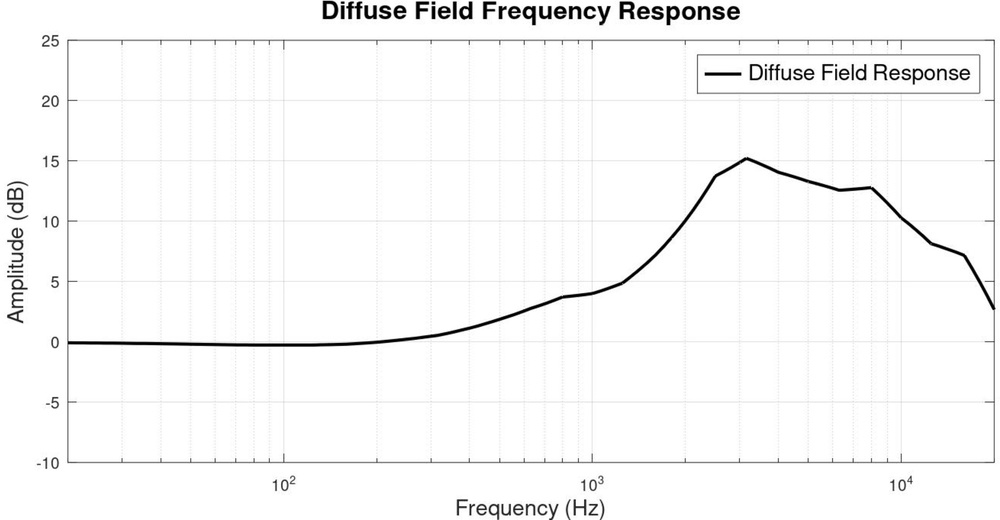
In a diffuse field, sound pressure is equal at every frequency from every direction, corresponding to a theoretically perfectly reflective room. The graph below shows how the ear simulator responds in that environment.
Its peak represents the HRTF (Head-Related Transfer Function): the effect of the HATS' head and artificial ears on sound reaching the eardrum. In this context, the terms ear gain and ear resonance describe the same behavior.
The simulator aims to represent human heads and ears, not duplicate every listener's HRTF. Some measurements of real people show less ear gain. These individual differences do not prevent the response from serving as a quantifiable reference for a preference model rather than an absolute standard.
Choosing the Tilt and Bass Shelf
Harman's approach begins with good speakers in a good semi-reflective room and the sound that reaches a listener's eardrums there. Early room reflections create a frequency response tilt whose magnitude depends on the room.
Research-backed speaker targets provide useful references. RTINGS.com selected a 6 dB tilt across the audible band primarily for consistency with its own speaker target and published targets from Dr. Floyd Toole and Harman.3,4
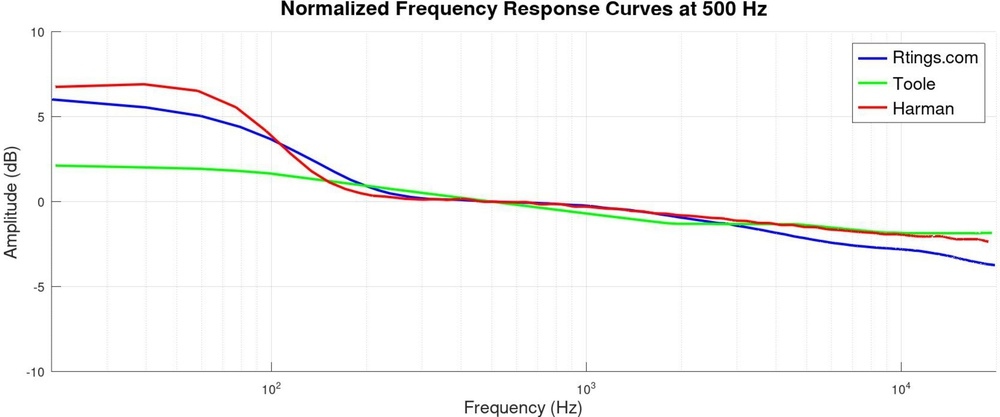
This tilt also brought the target close to the midrange and treble measurements of several known Harman-compliant models: the TruthEar Crinacle ZERO: RED, Sennheiser HD 600, and HiFiMan Sundara 2020. These were visual sample checks, not a more elaborate basis for the design.
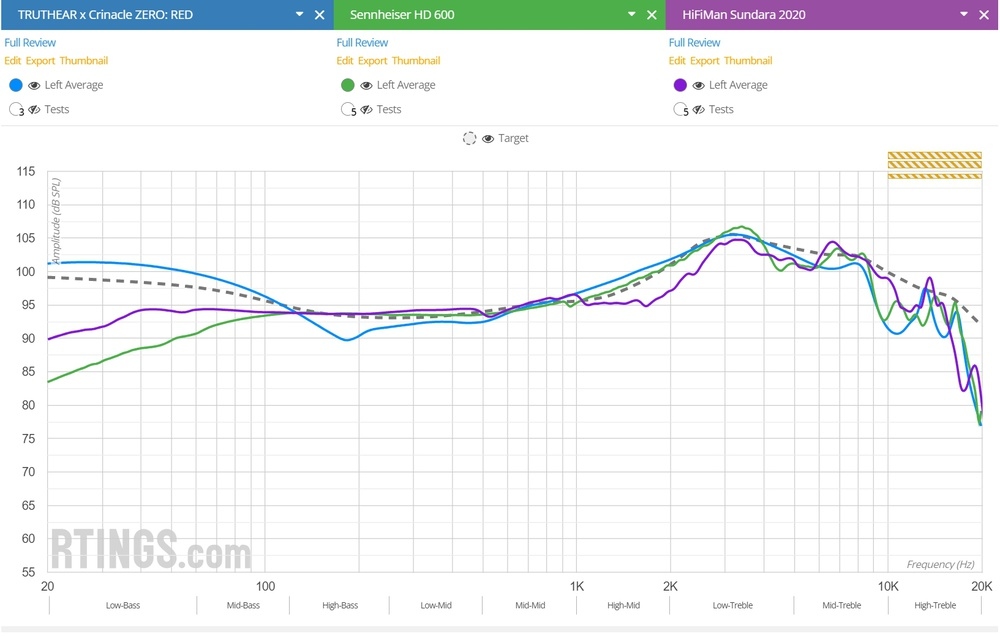
For bass, RTINGS.com chose a shelf similar to Harman's. There is no theoretical difference between the bass-region diffuse field responses of the 5128 and the GRAS fixture used by Harman. Starting from a tilted curve rather than Harman's in-room response produces small bass differences, but the aim is a broadly similar signature. Although the two fixtures do measure differently in practice, those bass differences are not consistent or repeatable across headphones.
The target is smoothed to 1/6th octave to emphasize overall tonality. Its starting diffuse field response already lacks substantial peaks and dips, but a smooth reference better serves this purpose. Actual headphone measurements use finer 1/12th octave smoothing so response variations remain easier to inspect.
The resulting target is intended as a straightforward approximation of a tonal balance that a majority may enjoy—not a universal definition of sound quality.
How to Read the Updated Reviews
Personal preference does not make every headphone equally good. Some sound profiles are clearly unbalanced, while others provide a more balanced spectral presentation. Nevertheless, neutrality may not be every listener's goal.
RTINGS.com continues to publish a Neutral Sound score while moving toward more descriptive sound assessments. Its advice is to look beyond that score: inspect the Sound Profile graph and consider whether the bass and treble levels suit your taste. The target is a reference, not an absolute quality measure.
The updated bench uses one target for headphones and in-ear monitors (IEMs). IEMs appear to exhibit larger bass-response differences between IEC 711 couplers and Type 4620 ear simulators, but the reasons are not yet fully understood. RTINGS.com does not consider the evidence strong enough to justify a substantially more V-shaped IEM target. It also reports that most well-liked IEMs perform quite well against the current reference.
Headphones v1.8 introduced these related measurement and scoring changes:
- The sound profile box identifies the frequency used for normalization, or zero crossing.
- Frequency response is measured at 94 dB SPL, bringing the procedure closer to accepted standards (IEC 60268-7).
- “Compliance to Target” replaces Bass-, Mid- and Treble Accuracy. The underlying measurements remain the same.
- “RMS Deviation” replaces “STD Error” to better reflect the intended interpretation.
- RMS Deviation scoring penalizes small departures less heavily, recognizing that some deviation need not be a flaw.
- Peaks and dips are scored as an objective metric and contribute to the Neutral Sound usage score.
How Earlier Research Fits
Research into headphone reproduction has made substantial progress in defining and measuring audio fidelity. RTINGS.com's approach builds on that work rather than replacing it.
The Circle of Confusion
Dr. Floyd Toole's “circle of confusion”3 describes a fundamental difficulty: without standardized listening conditions during content creation and playback, creators cannot know how audiences will hear their work, and audiences cannot know exactly how it was intended to sound. Shared standards could allow reproduction to match the conditions used in production.
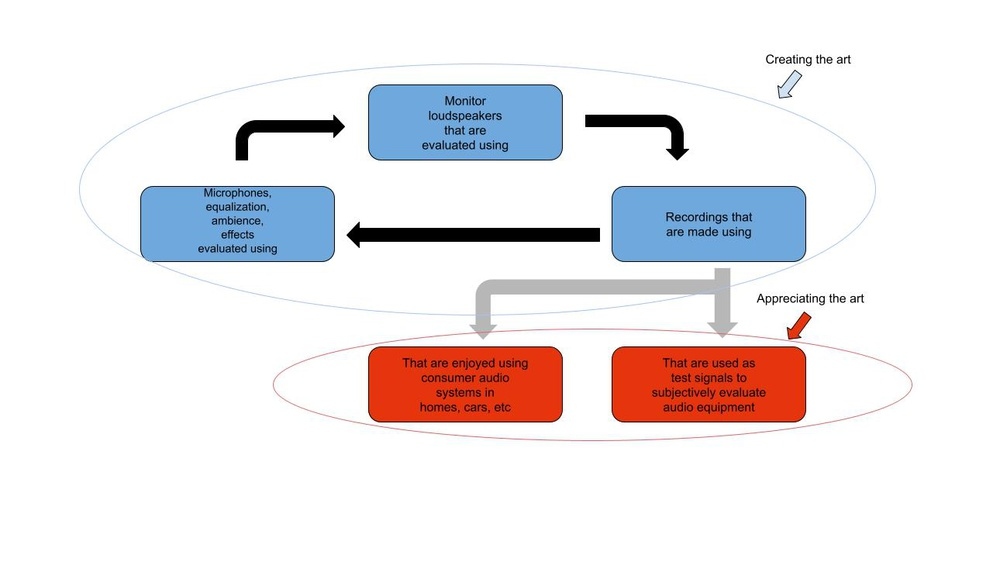
Against that background, RTINGS.com does not regard identical sound profiles across all headphones as either a realistic or desirable design objective, nor does it interpret the research as pursuing that outcome. The common goal is better sound and helping listeners find headphones or earbuds that suit them.
What Harman Established—and What Remains Open
The work of Dr. Sean Olive, Todd Welti, and the Harman team has been central to headphone sound-quality research. The Headphones v1.8 target broadly aligns with Harman's proposal, but it is not a direct translation: Harman's testing conditions and in-room response cannot be reproduced.
RTINGS.com supports Harman's methods and the preference-based foundation, particularly while the circle of confusion remains unresolved. It also emphasizes that preferences vary. Harman tested hundreds of people over many years, but an average target cannot represent every participant.
Allowing listeners full control over bass and treble may be the least biased way to assess those preferences, yet averaging the adjustments still yields a single curve. Questions remain about whether a different starting in-room response would shift the result, or whether some listeners would select a different tilt if given that option. RTINGS.com therefore considers a simple adjustment of the diffuse field response potentially sufficient as an approximation, rather than treating one exact response as settled.
Harman's own findings show substantial variation.2 Although most listeners preferred bass near the target level, 36% differed: 21% wanted less and 15% wanted more. RTINGS.com's stated aim is to help all listeners find suitable headphones, not only the 64% whose bass preferences align with that baseline.
Preference Research on the Type 5128
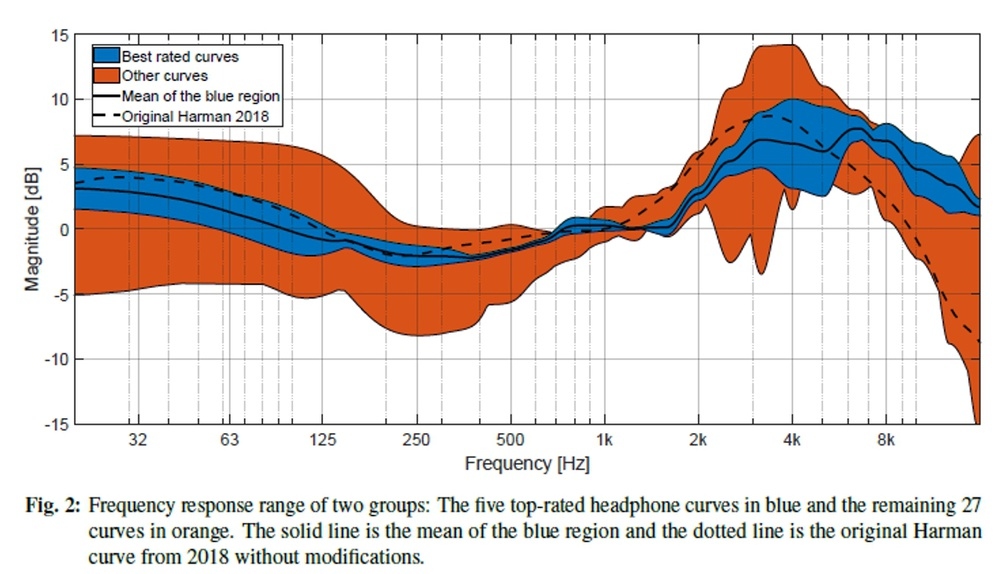
At the time of the article, RTINGS.com knew of only one formal preference-target study for the Type 5128 HATS: An Over-Ear Headphone Target Curve for Brüel & Kjær Head and Torso Simulator Type 5128 measurements. Conducted jointly by Senselab Force Tech in Denmark and The University of Aizu in Japan, it asked 56 participants to evaluate 32 frequency response curves.
The approach resembled RTINGS.com's test, but the wider selection included many unusual or outlying responses. The researchers selected the five best-rated curves and averaged them rather than identifying a single winning curve. The substantial bass and treble differences among those five support the possibility of a range of acceptable targets.
A Reference That Leaves Room for Taste
Perceived headphone sound quality cannot be separated completely from subjective judgment, even in extensive research. Objective references remain valuable, but disagreement among listeners is expected, and further research can improve the available guidance.
After Headphones v1.8, RTINGS.com added multiple preference curves to its graphing tool in v2.0 and expanded coverage to include the JM-1 HRTF in v2.1. The aim is to let readers view sound profiles compensated against various known preference targets and calibrated responses, including the diffuse field response. RTINGS.com also plans to consider additional valid targets developed for the Type 5128 platform.
A reference does not excuse arbitrary or poorly executed tuning. It does, however, allow a sound signature to depart from the target while remaining well executed and enjoyable. Readers can try equalizing measured headphones to the target and share both their listening preferences and feedback on the revised reviews to help inform future test-bench development.